StockChartX
Charting Library
The original financial charting component, in continuous development since 1997, used in numerous commercial applications, and trusted by millions of traders. One proven engine, two editions: a native C++ build that renders millions of data points, and an HTML5 build for web and mobile, both available with complete source code.
We built StockChartX specifically for trading at a time when most libraries came from charting vendors who knew graphics far better than they knew markets. That focus is why TradeStation, VertexFX, cTrader, TradeNavigator, and dozens of other platforms ship with StockChartX as their charting component of choice.
Backed by 30 years of trading-system engineering, StockChartX is built to be the chart layer of modern, AI-powered fintech applications. Plug it into trading apps, research dashboards, signal platforms, and operator tools, then wire it to your LLMs, prediction models, and trading systems to see signals exactly when your models surface them. Every edition ships with skill files and MCP servers alongside the source, so AI coding assistants and your engineers can implement and extend StockChartX side by side.
Since 1997
The original, since 1997
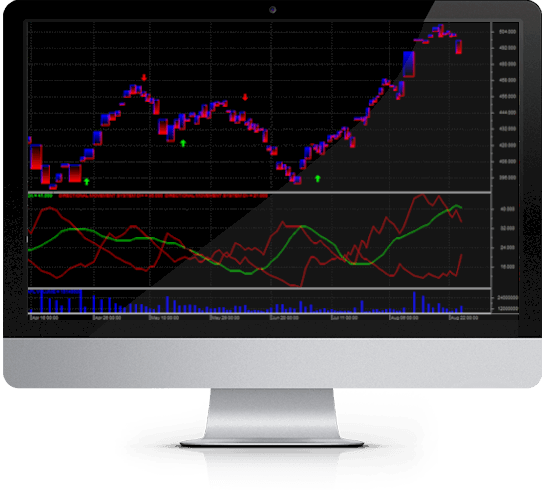
The native C++ edition is engineered for raw speed and performance. Its highly optimized code renders millions of datapoints while using very little memory and CPU, light enough to drive every monitor on a multi-screen trading desk. It integrates cleanly with multiple languages including Python, C#, F#, R, Go, Rust, and more.
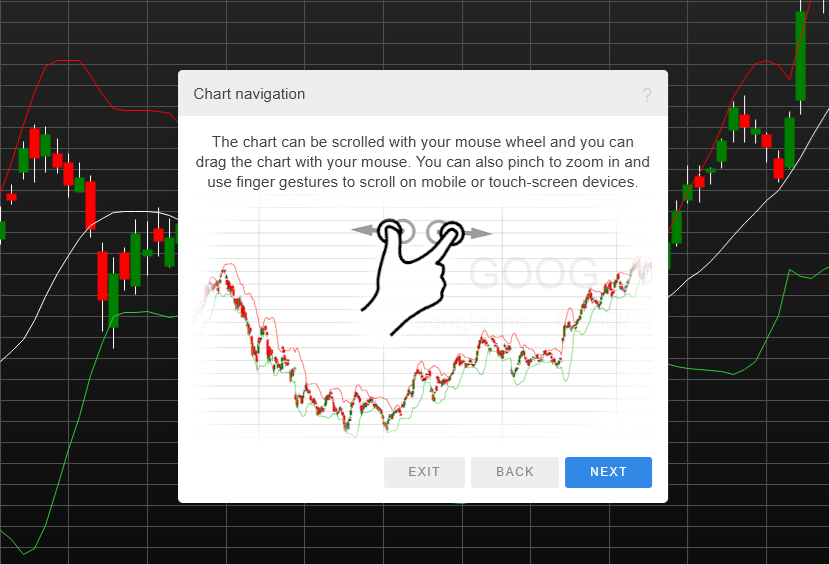
The HTML5 edition is written in JavaScript and rendered on an HTML5 canvas, running in any modern browser with no plugins. It works identically across desktop, tablet, and smartphone, with full mouse and keyboard controls on the desktop and pinch, swipe, and tap gestures on touch devices, one consistent technical-analysis toolset everywhere.
Every chart style traders expect
StockChartX supports the full catalog of professional price styles, updated in real time from any data source or our SuperWebSocket Data Server. Anti-aliased, double-buffered painting means smooth, flicker-free charts even under a heavy stream of live ticks.
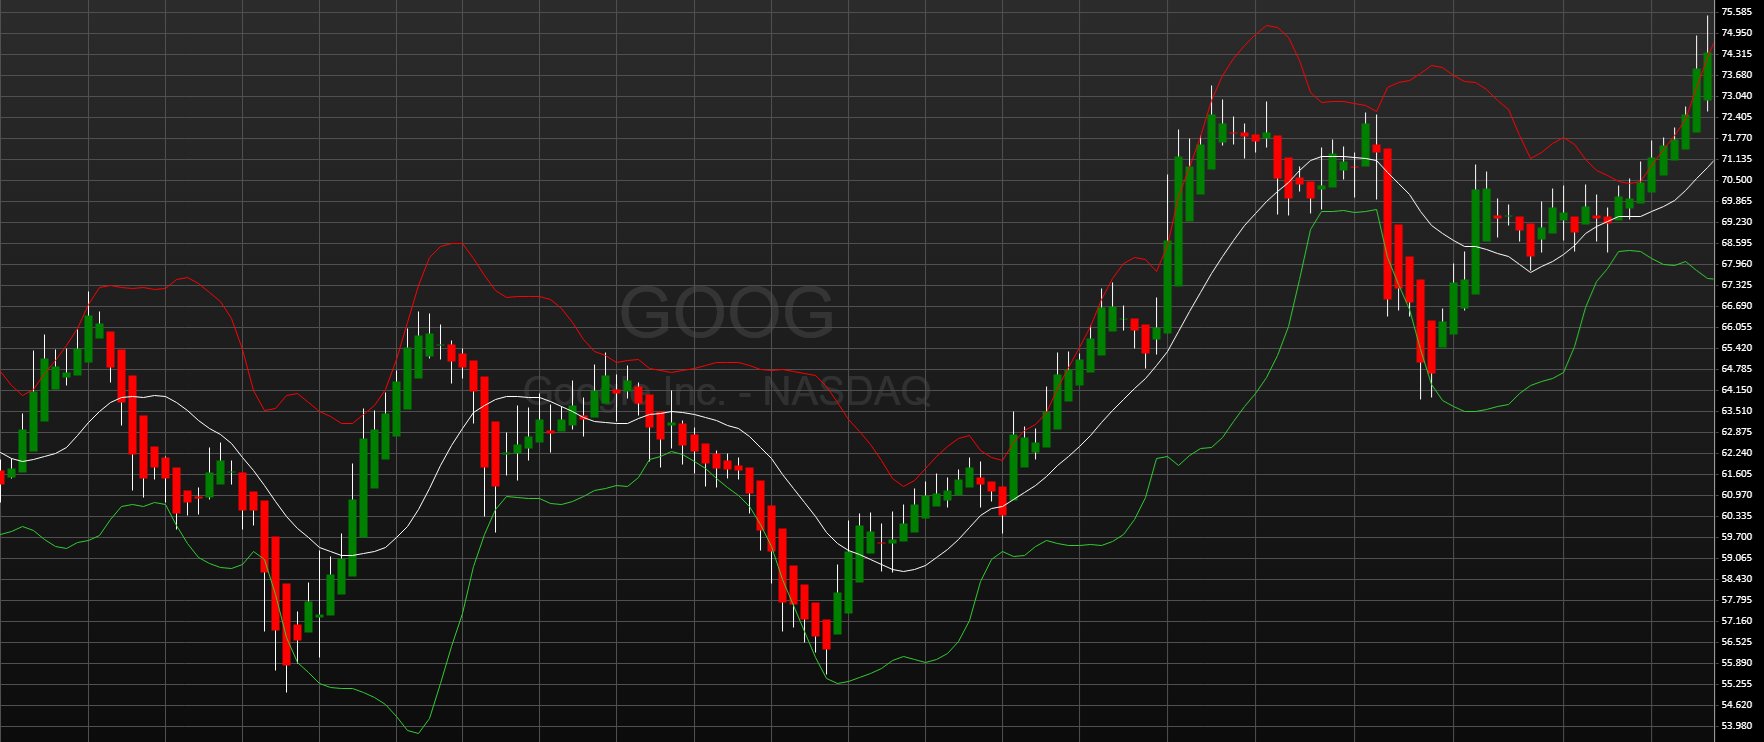
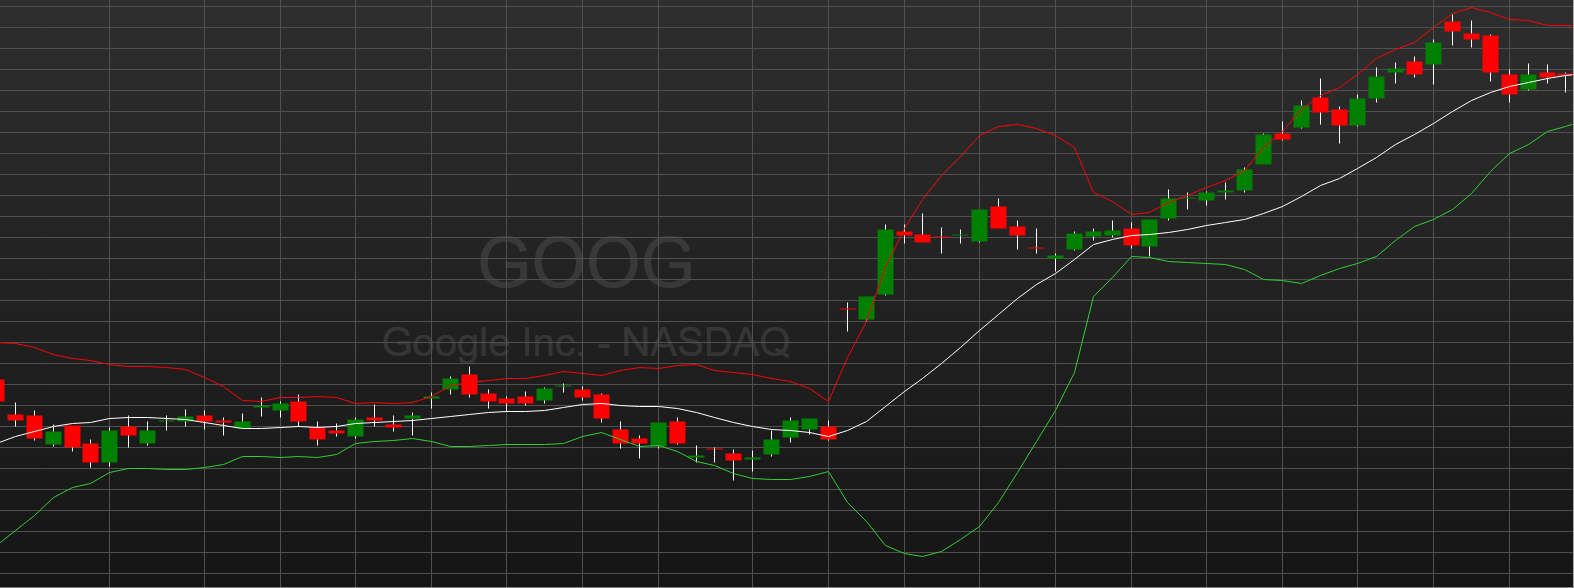
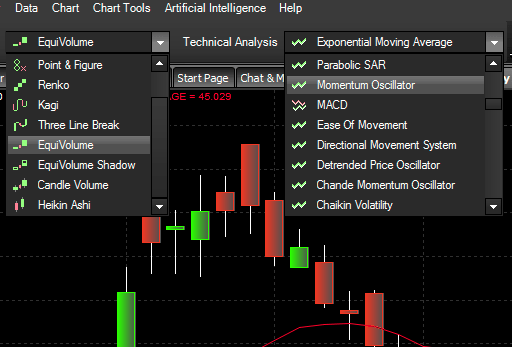
- Candlestick, OHLC, OHLCV, and HLC bars
- 2D and 3D candlesticks plus Heikin Ashi
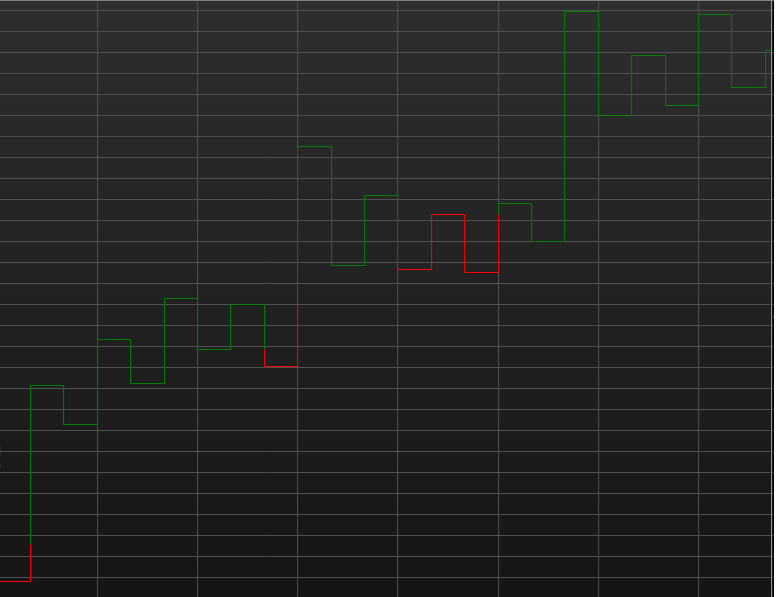
- Renko, Kagi, and Three Line Break
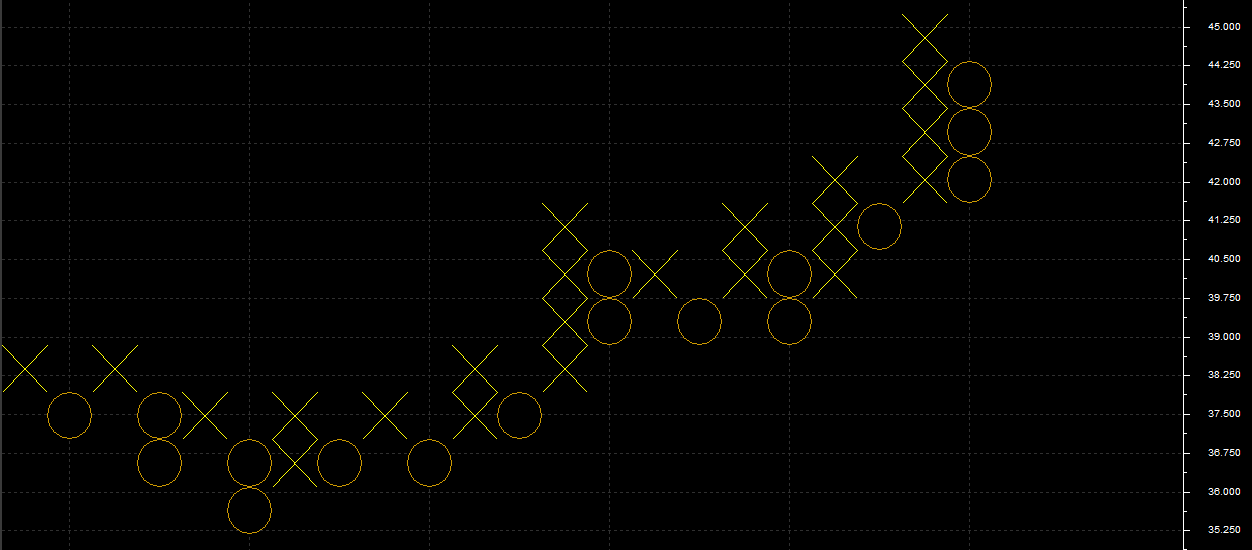
- Point & Figure and Range Bars
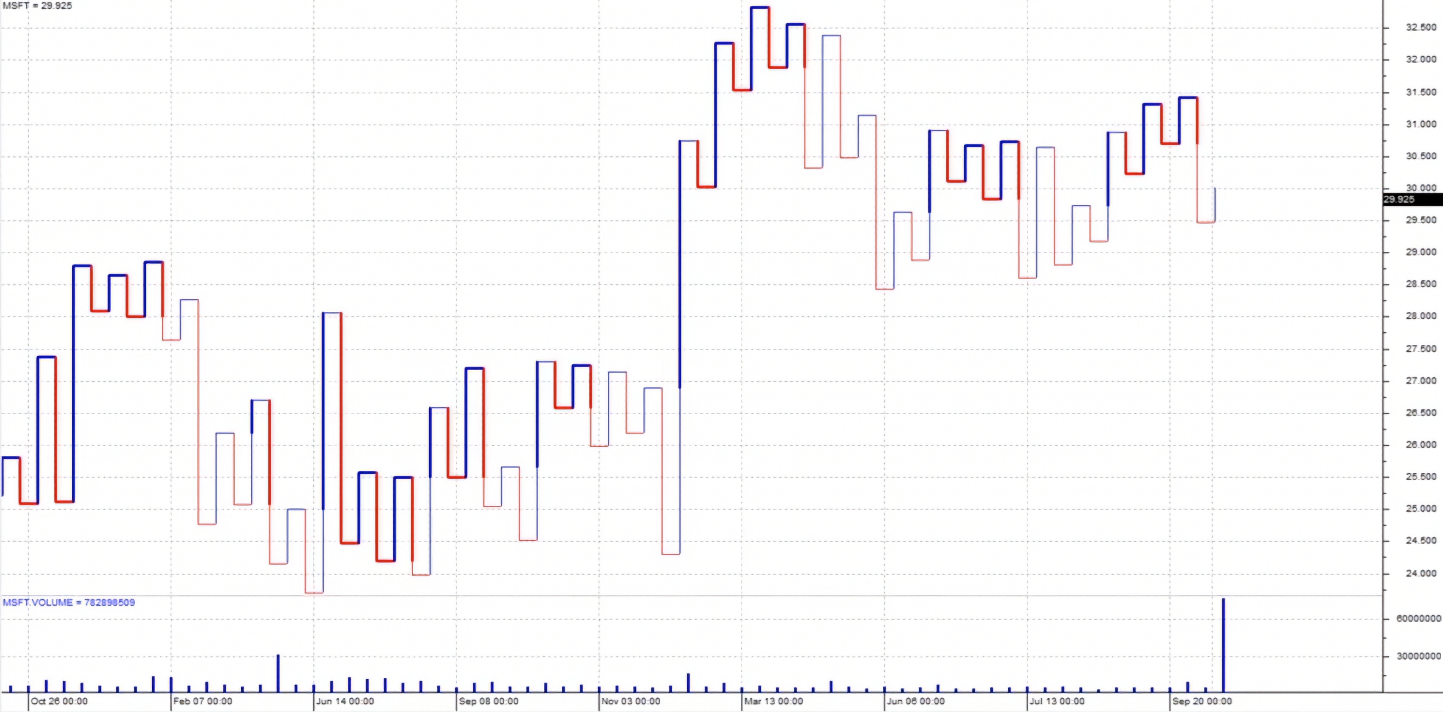
- Candle Volume, Equi Volume, and Shaded Equi Volume
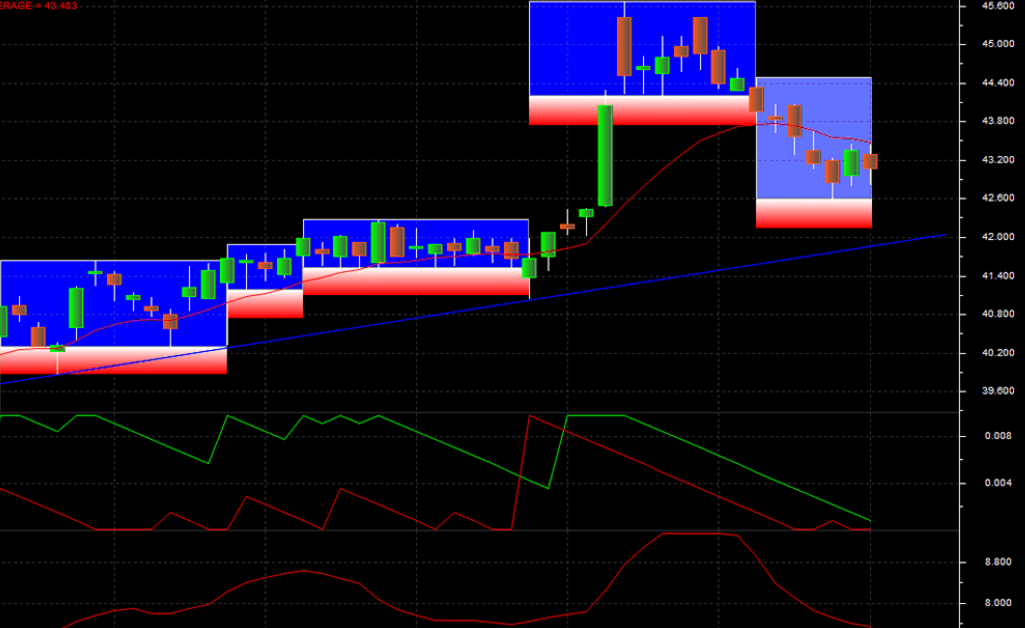
- Darvas Boxes, mountain, and line series
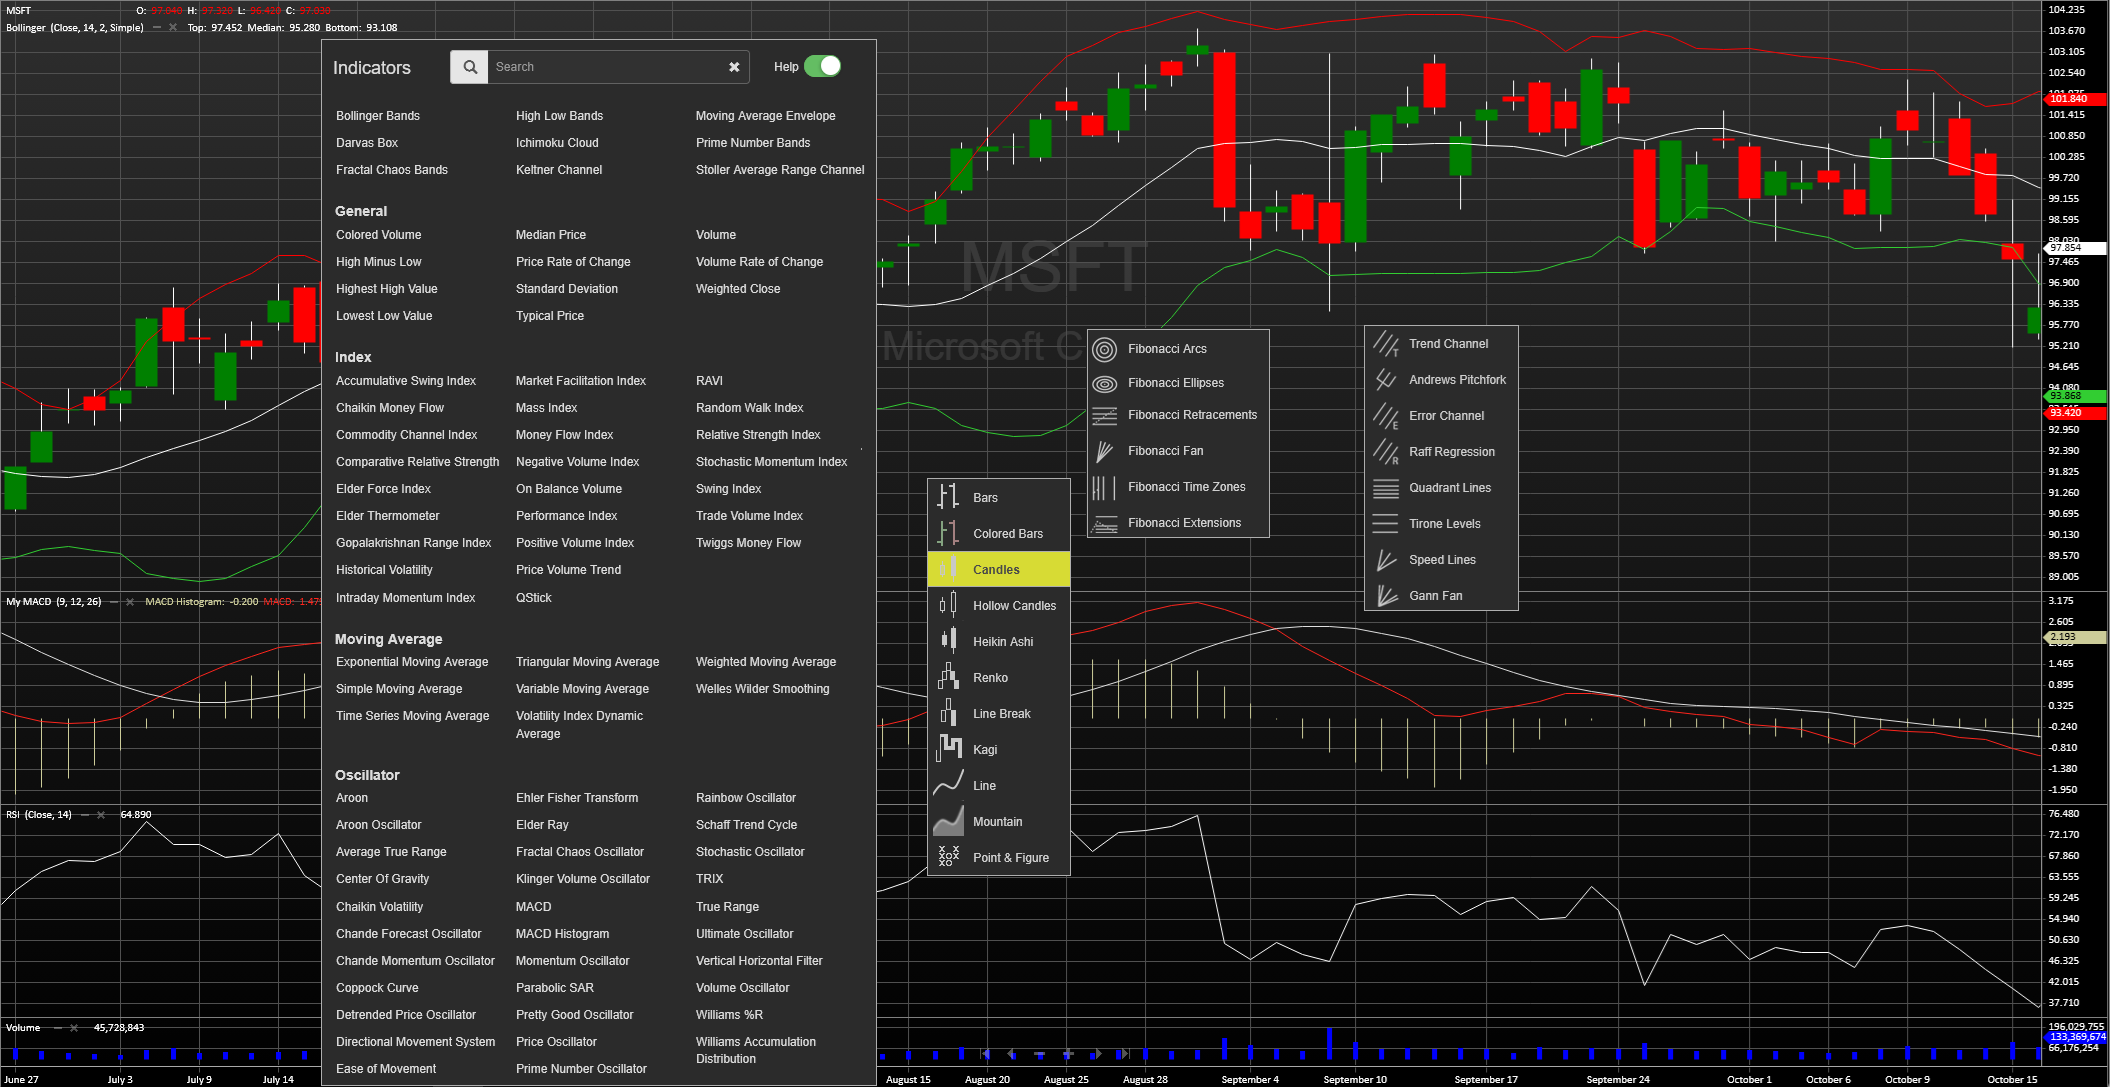
Validated technical indicators
StockChartX comes with over 150 popular technical indicators and line studies, each customizable with user-defined parameters. Wherever possible the calculations were validated by the indicators' original authors, so your output is provably correct. This quality earned StockChartX 5 stars by Futures and Stocks & Commodities magazines.
Recent additions include Elder Ray, the Keltner Channel, the Coppock Curve, and Twiggs Money Flow, alongside a deep set of Fibonacci tools, Gann fans, speed lines, Tirone levels, Raff regression, and error channels. You can also retrieve indicator values programmatically without ever drawing them on screen.
Built for real-time, real-world workloads
Data can be pushed into the chart through a single function call, so it makes no difference whether it arrives from a real-time data feed, database, text file, XML, or any other source. An unlimited number of time series and panels can share one chart, limited only by screen size.
The charting engine is fast enough for demanding scientific use, too: NASA runs a modified build of StockChartX to visualize International Space Station health and telemetry data, up to four million data points every ten milliseconds. Charts can be zoomed, scrolled, exported as images, printed, and saved or restored complete with data, indicators, drawings, and styling.
Let's build.
Request an instant meeting or schedule a call with our team to discuss your financial charting needs.
Made for buy- and sell-side workflows
StockChartX is data agnostic by design, so the same engine fits every desk in the firm. Front-office traders, analysts, and portfolio managers use it for time-series analysis and cross-sectional plots that show related instruments at a single moment, while back-office compliance and surveillance teams use the same charts for review, reconstruction, and reporting.
Plot data across every asset class, equities, futures, options, FX, and fixed income, alongside news, research, social posts, and economic releases, all in their proper time and price context. Events can sit on the chart as point markers or run as swim lanes across the time axis, so a single view ties together everything the desk is reacting to. Add third-party datasets, alternative data, or your own proprietary content, and the chart becomes a single window into everything that matters.
For serious technical analysts
StockChartX covers what advanced analysts need to spot patterns, anticipate trends, and act with confidence. The library carries more than 150 technical indicators, 20 chart types, and an extensive set of drawing tools. Apply any study to any chart style at any time increment, sub-second, intraday, daily, weekly, monthly, including Renko, Kagi, Three Line Break, Equivolume, Candlevolume, and Point & Figure.
A scrolling tick chart shows each transaction as it happens, and Modulus AI can flag custom signal events with markers right on the chart. Linked graphic experiences connect term structures, option curves, and other cross-section plots back to the underlying price action. A flyout Study Browser lets traders find indicators by search, recent use, favorites, popularity, or category, with a detailed write-up on each one. Firms can curate the list, hide what they don't license, and add their own categories, such as 'Premium', to highlight exclusive content.
Trade Visualization for analysis and compliance
Many events on a chart are not a single point in time. They have a beginning, middle, and end. StockChartX Trade Visualization plots that full lifespan so an analyst can see the real impact of an event on market activity. Because you host StockChartX yourself, your own order, chat, phone, and OMS/EMS data stay inside your environment while you reconstruct what happened.
For compliance and oversight teams, Post-Trade Visualization sits at the center of regulatory review. Reconstruct trades from logged communications, visualize the sequence of events, and reassemble the lifecycle of an order to meet Dodd-Frank and MiFID II requirements. Transaction Cost Analysis benefits too: each execution is plotted against bid and ask, so price impact, slippage, liquidity changes, and algo performance are visible at a glance.
- Plot the lifecycle of an order alongside live market data
- Merge proprietary chats, call logs, and OMS/EMS data with market data
- Reconstruct order sequences for Dodd-Frank and MiFID II reviews
- See slippage, liquidity fluctuations, and algo performance in one view
- Add Study Calculator indicators to screeners and alert engines
- Include the same charts directly in TCA reports
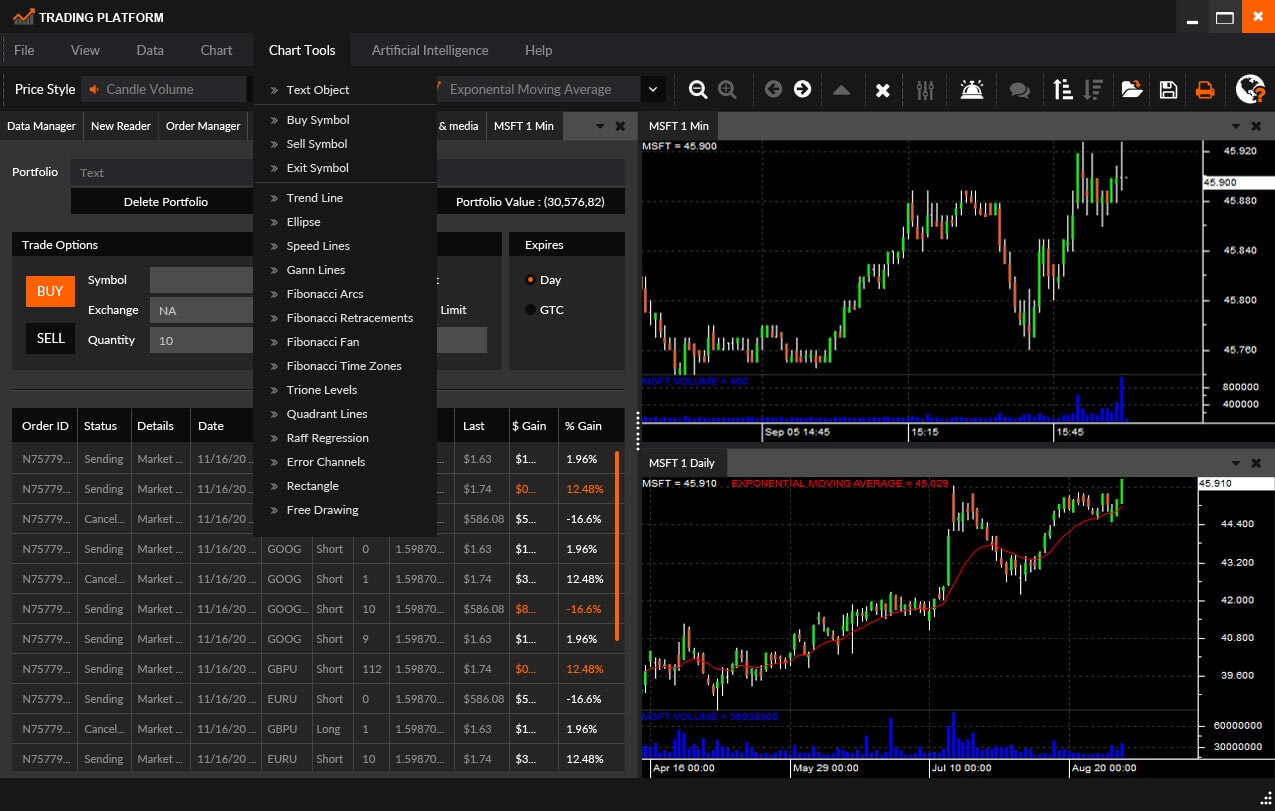
Modulus Trading Platform
Modulus Trading Platform, built on the StockChartX engine, is a plug-and-play, white-label trading toolkit delivered across web, mobile, tablet, and desktop from a single library. It connects to the back-end of your choice. Modulus never requires you to use our infrastructure or our data, and you keep full control of the UI and everything it touches.
For active traders, the Modulus Trading Platform bundles a dedicated interface for fast order entry and review: a tabular trade blotter, a graphical market-depth view for supply and demand, bid and ask levels with depth, every tick on a scrolling chart with sub-minute and sub-second studies, and a Level 2 heatmap that charts the order book over time.
- Tabular display of market transactions and trade history
- Graphical market-depth view of supply and demand balance
- Order book with volume profiles for industry-specific insight
- Bid (buy) and ask (sell) levels with order book depth
- Scrolling tick chart and sub-minute, sub-second studies
- Open orders and direct order entry from the book or the chart
- Level 2 heatmap of the order book through time
- Drop-in templates for interactive time-series charts
Options Analytics
For options desks, StockChartX answers the questions that drive every trade: calls or puts, which expiry, which strike. Traders watch implied volatility, volume, open interest, greeks, and bid/ask update in real time, combine technical analysis with options market activity and position data, and use volatility to project a probable future price range.
Proprietary studies extend the picture further. The Sentiment by Strike study overlays options volume or open interest directly on the price chart, showing how peers and smart money are positioned without leaving the technical view traders already work in. Volatility cones, historical and implied-vol history, and put/call ratios plot alongside the underlying, and option-curve shifts can be compared over time, across expiries, or across instruments.
- Real-time implied volatility, volume, open interest, greeks, and bid/ask
- Technical analysis combined with options activity and positions
- Volatility-based projections of a probable future price range
- Historical vol, implied-vol history, and put/call ratios with the underlying
- Compare option curves over time, across expiries, or across instruments
- Sentiment by Strike study for peer and smart-money positioning
SDK, customization, and fast time to value
The StockChartX SDK is built to shorten the path from contract to production. It ships with APIs, interface templates, sample implementations, add-on modules, and a clear Getting Started guide, plus direct customer support from the engineers who maintain the library. Teams onboard quickly, see real value early, and avoid the long-tail integration work that usually slows charting projects.
Because StockChartX is a single library that runs inside a native OS application, any modern browser, or an embedded WebView, it works on every platform and framework your product targets, and integrates with any programming language. Deliver a custom set of technical studies, drawing tools, and chart styles, and shape the chart API to fit any UX design standard. For proprietary trading firms and trading-education companies, Modulus also implements custom, proprietary indicators and graphics, the studies your edge depends on, built into your StockChartX build and kept private to your firm.
Technical indicators reference
Every indicator in the StockChartX library is listed below. The calculations were validated, wherever possible, by the indicators' original authors, work that earned recognition from Futures and Stocks & Commodities magazines. Click any name to read the background on Wikipedia.
- Simple Moving Average
- Exponential Moving Average
- Time Series Moving Average
- Variable Moving Average
- Triangular Moving Average
- Weighted Moving Average
- VIDYA
- Welles Wilder Smoothing
- High Minus Low
- Median Price
- Typical Price
- Weighted Close
- Volume Rate of Change
- Price Rate of Change
- Standard Deviation
- Highest High Value
- Lowest Low Value
- Linear Regression R2
- Linear Regression Forecast
- Linear Regression Slope
- Linear Regression Intercept
- Time Series Forecast
- Bollinger Bands
- Moving Average Envelope
- High Low Bands
- Fractal Chaos Bands
- Prime Number Bands
- Money Flow Index
- Trade Volume Index
- Swing Index
- Accumulative Swing Index
- Relative Strength Index
- Comparative Relative Strength
- Price Volume Trend
- Positive Volume Index
- Negative Volume Index
- On Balance Volume
- Performance Index
- Mass Index
- Chaikin Money Flow
- Commodity Channel Index
- Stochastic Momentum Index
- Historical Volatility
- Chande Momentum Oscillator
- Momentum Oscillator
- TRIX
- Vertical Horizontal Filter
- Ultimate Oscillator
- Williams %R
- Williams Accumulation Distribution
- Volume Oscillator
- Chaikin Volatility
- Stochastic Oscillator
- Price Oscillator
- MACD
- MACD Histogram
- Ease Of Movement
- Detrended Price Oscillator
- Parabolic SAR
- Directional Movement System
- True Range
- Average True Range
- Aroon
- Aroon Oscillator
- Rainbow Oscillator
- Fractal Chaos Oscillator
- Prime Number Oscillator
- Elder Ray Bull Power and Bear Power
- Elder Force Index
- Elder Thermometer
- Ehler's Fisher Transform
- Keltner Channel
- Market Facilitation Index
- Schaff Trend Cycle
- QStick
- Stoller Average Range Channels
- Center Of Gravity
- Coppock Curve
- Chande Forecast Oscillator
- Gopalakrishnan Range Index
- Intraday Momentum Index
- Klinger Volume Oscillator
- Pretty Good Oscillator
- RAVI
- Random Walk Index
- Twiggs Money Flow
- LLM Prediction
- And more...
White-label, share, and integrate
StockChartX is the first and only professional-grade white-label charting library that runs inside any application on any platform or framework from a single codebase. Brand it to match your product, drop in your own data and proprietary content alongside market data, and give users a chart that looks and feels like yours, not a third party's.
The same library is built for the practical work of publishing and sharing. Add axis titles, show or hide series, and run an offline batch to capture a consistent set of images for reports or research. Share a live chart into Teams, Slack, X, LinkedIn, or any other channel your firm uses. Custom events on the chart can carry text, links, images, videos, and animations, so research notes, news clips, and product walkthroughs live in the same place as the price action. Multiple charts in a single workspace can hold either multiple instruments at one timeframe or one instrument at several timeframes, with each pane controlled independently or driven by saved templates.
Pre-configured APIs connect StockChartX to outside news feeds, prebuilt datasets, AI-driven research providers, and analytics vendors. The chart can carry your full research stack rather than just price data, and your team adopts new sources without writing custom integration code.
Built for developers
A complete, documented charting toolkit with example projects, full source code, and editions for nearly every platform your application targets.
Native C++ performance
A compact, highly optimized C++ control with no third-party graphics engine and no runtime dependencies, the fastest charting component available, with an optional 64-bit build for even more headroom.
Web and mobile in one
The HTML5 edition runs client-side on any web server and any modern browser, scaling from desktop monitors to phones with a single codebase and a consistent interface.
Flexible developer API
Accept CSV, SQL, or real-time data; add trend lines, retracements, and custom indicators programmatically; attach custom toolbars and buttons; and reskin with themes and visual styles.
Interactive by design
Users grab, move, resize, and overlay series with the mouse or touch, drag objects between panels, and place buy, sell, and exit markers, text, and images directly on the chart.
Save, load, and export
Persist charts to binary files restoring data, indicators, colors, drawings, and period objects, then export images for the web or send them straight to a printer.
Source code and examples
Every edition ships with full source code and dozens of example projects, so you can add new indicator types, customize appearance, and tailor the library to your exact requirements.
Editions, platforms, and capabilities
Choose the edition that fits your stack, each shares the same charting heritage and indicator library.
Available editions
- StockChartX C++ (Windows, native)
- StockChartX C# / WPF for .NET
- StockChartX JavaScript / HTML5
- StockChartX Java
- StockChartX iOS (Objective-C)
- Optional 64-bit high-performance build
Charting & analysis
- Real-time, tick-by-tick updating
- 150+ indicators and line studies
- Retrieve indicator values without drawing
- Trend-line penetration events
- Semi-log or linear scaling
- Unlimited series and panels per chart
Integration & deployment
- Push data from any database, file, or feed
- SuperWebSocket Data Server compatible
- Powers the Modulus M4 trading platform
- No plugins or runtime files required
- Gestures on mobile, full controls on desktop
- Recognized by Futures and Stocks & Commodities
Related
TA-SDK Technical Analysis
The award-winning technical-analysis library behind the indicators in StockChartX.
Read more →ModScript Language
The flexible scripting language traders use to define studies, signals, and strategies.
Read more →Source Code License
Get StockChartX with full source-code under a perpetual commercial source code license.
Read more →Let's build.
Request an instant meeting or schedule a call with our team to discuss your financial charting needs.